How to be a good citizen on Linux
This is a short tutorial on how to be a good citizen in a shared Linux environment. At my own institution, there are many users per computer and we all have to connect and play nicely with each other. So how do we do that? The main resources we are monitoring are CPU, disk bandwidith (“I/O”), disk space, and RAM (“memory”). Then after figuring out what we need to regulate, how do we do that?
Monitoring
First, we have to understand how to know if we are taking up too many resources.
CPU
There are quite a few commands to see how much CPU you are taking.
I’ll just choose a couple here.
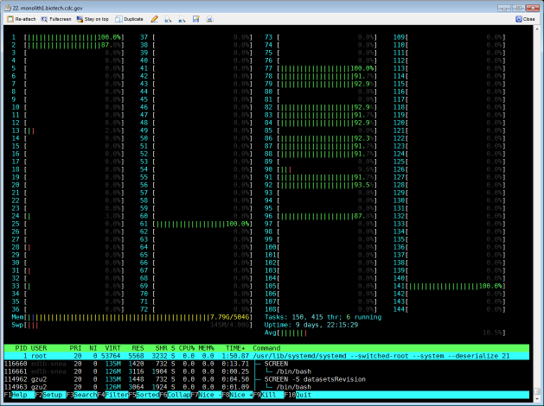
My favorite is htop which shows the load per processor
and an interactive menu of each process with child/parent relatedness.
To view just your own processes, run htop -u $USER, where $USER evaluates to your username.
You can also run htop with no arguments and if so, it will show you all processes.
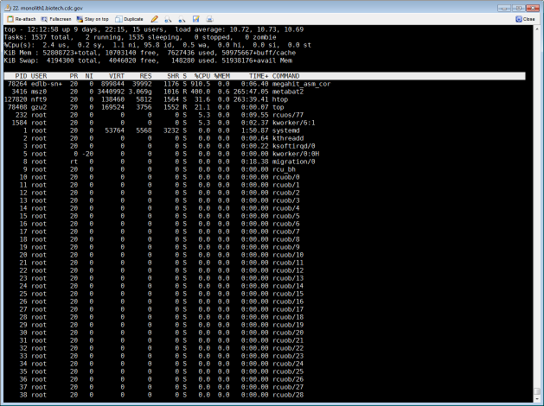
The command top is also available.
It is more simple but it is available on most Linux installations, where htop might not be available.
You can also run it the same way with top -u $USER.
Most of your processes will be single threaded, meaning that it will only take up to 100% of one CPU. You might be surprised if you are taking up many CPUs and if so, there are solutions later in this document.
Disk I/O
Another major limitation on resources is whether the hard drive is working too hard. Mainly if it is reading too much or writing too much. This is called bandwidth or disk input/output (I/O). Monitoring disk I/O usually requires admin privileges because it potentially allows any user to know what any other user is running. However, here is what you would do if you have the right privileges.
To see something in real time that refreshes automatically, just run it plainly:
sudo iotop
You can also just see a snapshot like so
sudo iotop --batch --only --processes --iter=1
The output should look similar to the following
Total DISK READ :       0.00 B/s | Total DISK WRITE :       0.00 B/s
Actual DISK READ:       0.00 B/s | Actual DISK WRITE:       0.00 B/s
PID  PRIO  USER     DISK READ  DISK WRITE  SWAPIN      IO    COMMAND
66543 be/4 gzu2        0.00 B/s    0.00 B/s  0.00 %  3.65 % spades config.info careful_mode.info
One way around this is to add the setuid sticky permission bit so that any user can run iotop.
sudo chmod -v u+s /usr/sbin/iotop
More information on the sticky bit here.
Disk space
There is also a limited amount of disk space and so you would want to be a good citizen by not taking up more than necessary.
Whole disk
One major way of monitoring disk space is with df like so
df -h -x nfs -x tmpfs
and the output format will look similar to the following
Filesystem                    Size  Used Avail Use% Mounted on
/dev/mapper/centos-root        50G   14G   37G  27% /
devtmpfs                      252G     0  252G   0% /dev
/dev/sdb1                     9.1T  427G  8.2T   5% /mnt/M1Data
/dev/sdb2                     1.8T  566G  1.2T  33% /scratch
/dev/sda2                     494M  245M  250M  50% /boot
/dev/mapper/centos-home       3.6T   33M  3.6T   1% /home
Folder
You can also calculate how much space a single folder and its subfolders take up using du.
This is one example command to look at /var and see the biggest folders.
du -xkh /var 2> /dev/null | sort -rh | head
This should show an example output such as
1.7G    /var
637M    /var/cache
632M    /var/cache/yum/x86_64/7
632M    /var/cache/yum/x86_64
632M    /var/cache/yum
503M    /var/cache/yum/x86_64/7/updates
457M    /var/cache/yum/x86_64/7/updates/packages
296M    /var/lib
280M    /var/spool/mail
280M    /var/spool
du options
- -x: don’t look at external drives (e.g., network storage)
- -k: block size 1K so that the units make more sense
- -h: “human readable”
sort options
- -h: “human-numeric-sort”
- -r: reverse (biggest first)
head then limits the results to the first ten entries.
RAM (“memory”)
Monitoring the memory can be as easy as running top or htop again.
It displays it cleanly in the interactive menu.
There is an additional command free that displays memory usage specifically.
Here is one example.
$ free -h
              total        used        free      shared  buff/cache   available
Mem:            15G         12G        2.7G         17M        223M        2.8G
Swap:           48G        1.5G         46G
Solutions
So let’s say you need to fix something. That you found something in the previous section when you monitored your resources. How do we fix it?
CPU
Use at most 1/4 or 1/3 of the total CPUs in your machine at a time when there are few people on the server. When the server is crowded, consider using fewer CPUs. You can do this by finding any program you are using with a greedy CPU algorithm. In other words, there are some programs that use all available CPUs which will not work with large machines. Therefore, it is optimal to specify the number of CPUs or threads you are using with any given program.
Additionally, consider that most programs do not offer much more speed with additional CPUs when you approach 8 of them. Therefore, most programs might actually not speed up if you use more than 8 CPUs.
You can also use nice and renice to give your programs a lowered priority.
If you give a program a lower priority, then it can still run just as fast!
But if someone else runs a job with a normal, not re-niced priority,
and there are not as many free CPUs available, yours will get a lower priority.
One more tip is that you can try to use another computer! This is only an option if you have the resources but it’s worth mentioning.
Disk I/O
If you are taking up too much disk input/output, considering doing less! Some people read and write multiple files at the same time and then are surprised that it is actually slowing down the hard drive!
Another option is to try to switch to a faster drive.
Most installations of Linux have a /tmp or /scratch drive
which might have less redundancy but will be much faster.
Copy all your input data to this drive, literally with the cp command.
Then, run your analysis and output to the same fast drive.
Finally, copy it back to your regular space.
If you make a space on /tmp or /scratch, make sure to have
your own personal space, e.g., mkdir /scratch/$USER.
One more tip is to apply the nice idea to disk bandwidth with the program ionice.
This will tell the system to run ls when there is idle disk bandwidth, when you use -c 3.
ionice -c 3 ls
Here is additional information since this is a less commonly used program.
$ ionice --help

Usage:
 ionice [options] -p <pid>...
 ionice [options] -P <pgid>...
 ionice [options] -u <uid>...
 ionice [options] <command>

Show or change the I/O-scheduling class and priority of a process.

Options:
 -c, --class <class>    name or number of scheduling class,
                          0: none, 1: realtime, 2: best-effort, 3: idle
 -n, --classdata <num>  priority (0..7) in the specified scheduling class,
                          only for the realtime and best-effort classes
 -p, --pid <pid>...     act on these already running processes
 -P, --pgid <pgrp>...   act on already running processes in these groups
 -t, --ignore           ignore failures
 -u, --uid <uid>...     act on already running processes owned by these users

 -h, --help             display this help
 -V, --version          display version
Memory
A lot of things take up a ton of memory especially if you load a large dataset. If this is the case, consider only running one process at a time. Or if multithreaded, some programs copy the internal memory for each thread and therefore run it single threaded.
If this is your program, consider how to make it more efficient! If it is an R or Java program, explicitly run garbage collection more often. If you load a large dataset, consider if you need all the data that come from it. If you can delete some of that dataset in memory, your program will take less memory and will run faster.
One more option is to “chunk” analyses. If you are analyzing a million-row table, maybe you can just analyze a thousand rows at a time instead of loading the whole table!
Disk space
This is probably the easiest concept. When your disk space is running low, deletion is the way to go. Delete any temporary files.
Additionally, there are many files that can be compressed
natively with the gzip protocol.
If the file is > 1M, then please consider gzipping the following file types
- fastq
- tsv
- csv
If you have SAM files lying around, convert them to BAM right away! Again, there is almost no reason to have a plain SAM file around.
Think outside the box
Many problems can be solved by more resources. If you are fortunate enough to have another computer, consider switching to that other computer if it’s more free. If you have an HPC, consider submitting jobs and letting the scheduler balance the load for you.
Social engineering
If you’re going to run a large job and it might hurt others, consider telling them! An email or an instant message might go a long way in being a good citizen and getting the resources you want.
Even when the computer is vacant, try to use only up to
4 or 8 threads per job, up to 1/4 or 1/3 of the total CPUs.
Even though you technically can just add --threads 64, you
can be a nicer person by just using --threads 4 and
building nice relationships with your colleagues.
When all else fails, or even before it all fails, don’t forget that you have people who want to help you! Reach out and get help!